
Opportunity Cost of a Larger Tank: Payload Loss Per Trip vs Fewer Refuel Stops
Defining the Payload-versus-Refuelling Tradeoff
A larger tank rarely appears as a line item on a quotation sheet, but a fleet pays for it on every trip it dispatches. Extra capacity means extra steel, baffles and fluid mass, and under a fixed gross vehicle weight rating that mass has to come out of cargo.
Every capacity decision therefore trades three things against each other: the cargo moved per trip, the tare weight carried whether the truck is loaded or empty, and the number of refuelling stops a duty cycle requires. Improve one and the other two usually give ground.
Opportunity cost, for the purposes of this article: the revenue-bearing payload a configuration cannot carry because tank volume, tare weight or axle limits consume the available gross weight.
That definition turns a vague preference for generous capacity into arithmetic. A tanker with 20 percent more tank capacity does not earn 20 percent more per shift. It earns what the remaining payload allows once tare and axle loading are satisfied, and the gap repeats on every load. Teams that map the gap before they order, as this framework for tank specifications sets out, usually avoid discovering it after delivery.
Two measurements make the trade visible. Payload loss per trip is the difference, in kilograms or delivered litres, between the payload a baseline configuration carries and the payload a candidate carries over the same route under the same axle limits. Refuel stop frequency is the number of replenishment events a duty cycle requires, counted per shift, per week or per 1,000 kilometres.
Both convert into money. Payload loss cuts revenue per dispatch; refuel stops consume driver hours, add yard congestion and make the schedule fragile. Neither number tells you much on its own.
Four inputs decide the balance: gross vehicle weight, cargo density, route length, and how often the truck has to refuel or reload product. Change one and the answer can move.
Two Cost Drivers That Move in Opposite Directions
A bigger tank buys volume at the expense of mass and fewer interruptions at the expense of legal cargo. The two effects pull the same purchase decision in opposite directions. Which one wins depends on what you haul and what a stop actually costs.
More tank capacity, less legal payload
The mechanism is straightforward. A larger tank raises the volume ceiling per trip. It also weighs more empty: more shell surface, more baffles, heavier heads and often a reinforcement package, all before a single litre or gallon goes in. The legal ceiling set by the bridge formula, axle ratings and regional gross weight limits does not move. Payload is the difference between the two, so anything added to unladen weight subtracts from it.
For weight-limited cargo, meaning dense liquids where the scale rather than the tank is the binding constraint, that is where the larger tank loses money. The truck can hold more but may not legally carry more, so each trip moves the same mass while dragging extra structure, extra fuel burn, and extra tyre and brake wear. Axle loading adds a second constraint: longer barrels shift the centre of gravity rearward, so a drive or trailer axle can reach its rating before gross vehicle weight does. The practical payload ceiling is then set by one axle rather than by the whole vehicle.
Fewer refuel stops per duty cycle
The benefit on the other side is time. Every refuel stop consumes dwell time: entry, queueing, authorisation, fuelling, paperwork and the pull-away. Fewer stops per duty cycle means less paid labour standing still, less detour mileage off the productive route and more of the shift available for revenue work. On fixed routes, one eliminated stop per cycle compounds across shifts, trucks and months.
When the trade pays
Compare the two in currency per duty cycle, not in litres, gallons or gut feel. The larger tank pays only when the stop time it saves is worth more than the payload it forgoes. Value the saved stop as labour hours plus detour mileage plus the margin on work the truck could have done instead. Value the forgone payload as revenue per unit of mass multiplied by the units the smaller, lighter tank would have allowed. If saved time wins, spec the larger tank. If forgone payload wins, keep the smaller one and accept the extra stops.
How that comparison falls out across different duty cycles and cargo densities is covered in this analysis of opportunity cost in truck tank specification.
A larger tank is neither automatically efficient nor automatically wasteful. It is efficient when the cargo is volume-limited and stops are expensive, and wasteful when the cargo is weight-limited and stops are cheap. Compare the two dollar figures per cycle, then let the arithmetic choose the specification rather than the tank size on the brochure.
Payload per Trip vs. Nominal Tank Capacity
Specifying the biggest tank on the lot is easy to defend: fewer refuel or discharge stops per shift, less deadhead time, a deeper buffer on long hauls. On a road-legal chassis, though, nominal capacity and deliverable payload are two different numbers. Gross vehicle weight (GVW) is fixed by axle ratings and local weight law, and every extra gallon of shell, baffle, bulkhead and fitting adds tare weight that comes straight out of the cargo you are allowed to haul.
The grouped bars below plot both variables against the same capacity ladder. Nominal tank volume climbs in a straight line, as you would expect. Legal payload per trip does the opposite.
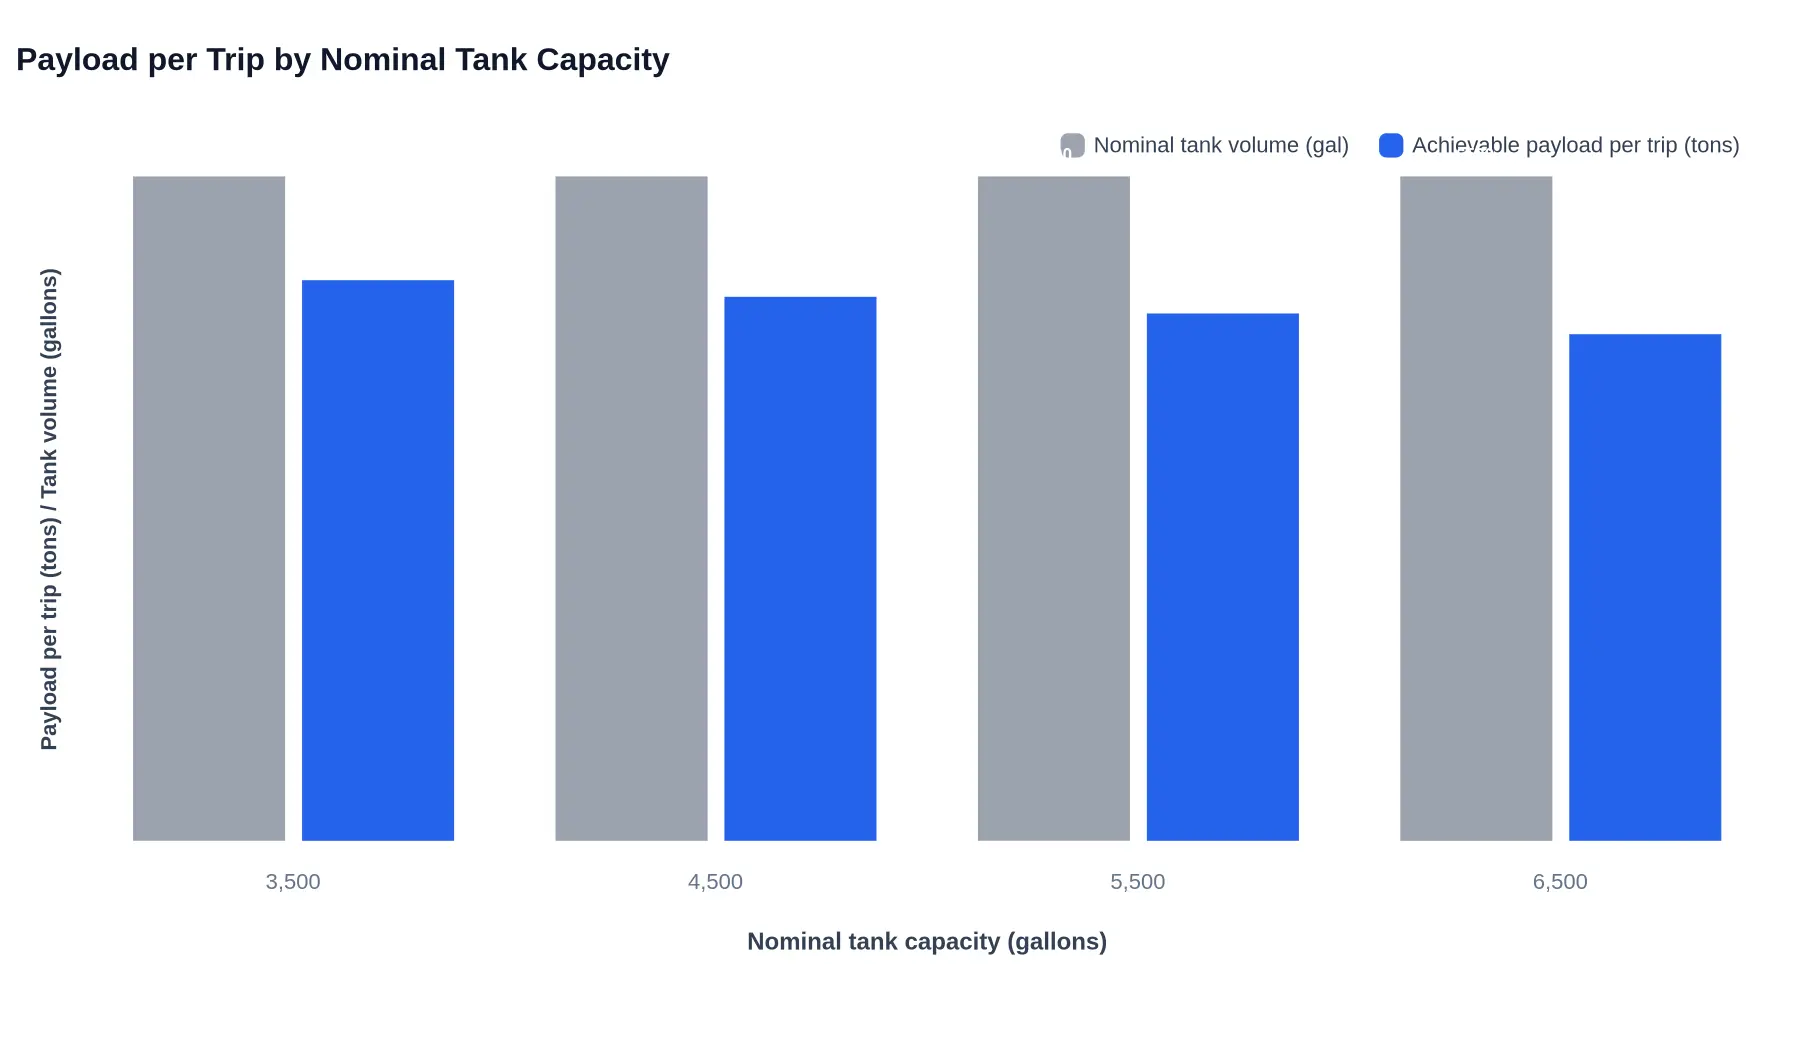
Figure 1: Legal payload per trip falls from 13.5 to 12.2 tons across the 3,500-to-6,500-gallon range, showing that the extra volume is bought with payload that can no longer be loaded.
Note: figures are illustrative and assume a fixed GVW limit of 52,000 lb, a fixed chassis and equipment weight of 22,000 lb, a tank tare allowance of 850 lb per 1,000 gallons (0.85 lb/gal, a lightweight build) and a cargo density of 8.34 lb/gal (water at 60°F). Insulated or heavier barrels reduce payload further. Actual results vary with chassis tare, tank material and baffling, axle loading, and local bridge and weight regulations.
The Numbers Behind the Bars
| Nominal tank capacity | Nominal volume (gal) | Tank tare allowance (lb) | Legal payload available (lb) | Payload per trip (tons) | Usable fill before hitting GVW |
|---|---|---|---|---|---|
| 3,500 gal | 3,500 | 2,975 | 27,025 | 13.5 | 3,240 gal (~93%) |
| 4,500 gal | 4,500 | 3,825 | 26,175 | 13.1 | 3,138 gal (~70%) |
| 5,500 gal | 5,500 | 4,675 | 25,325 | 12.7 | 3,036 gal (~55%) |
| 6,500 gal | 6,500 | 5,525 | 24,475 | 12.2 | 2,934 gal (~45%) |
The last column is where the business case sits. At 3,500 gallons the barrel is essentially full when the truck reaches its weight limit: 93% usable. At 6,500 gallons, more than half the shell is empty on every run: the fleet pays for fuel, tyres and tolls to move steel and air.
That is the opportunity cost of a larger tank. The stops you save have to be weighed against the tonnage you give up, trip after trip, for the life of the asset. For high-density liquids over short and medium routes, the smaller tank with more usable volume often wins on revenue per mile before driver time is even counted.
Our breakdown of the opportunity cost of a larger tank follows the same arithmetic through the rest of the duty cycle.
Quantifying Payload Loss Per Trip
A bigger tank is a trade, not an upgrade
Every gallon of tank capacity you add is steel and baffling carried on every trip, whether or not it is full. Fleets compare tanks on volume alone, but volume is free and weight is not. The vehicle is capped by its gross vehicle weight rating (GVWR), and every kilogram of tank tare weight added to the platform is a kilogram of revenue cargo left behind on every load, for the whole service life of the truck.
What a legal payload actually is
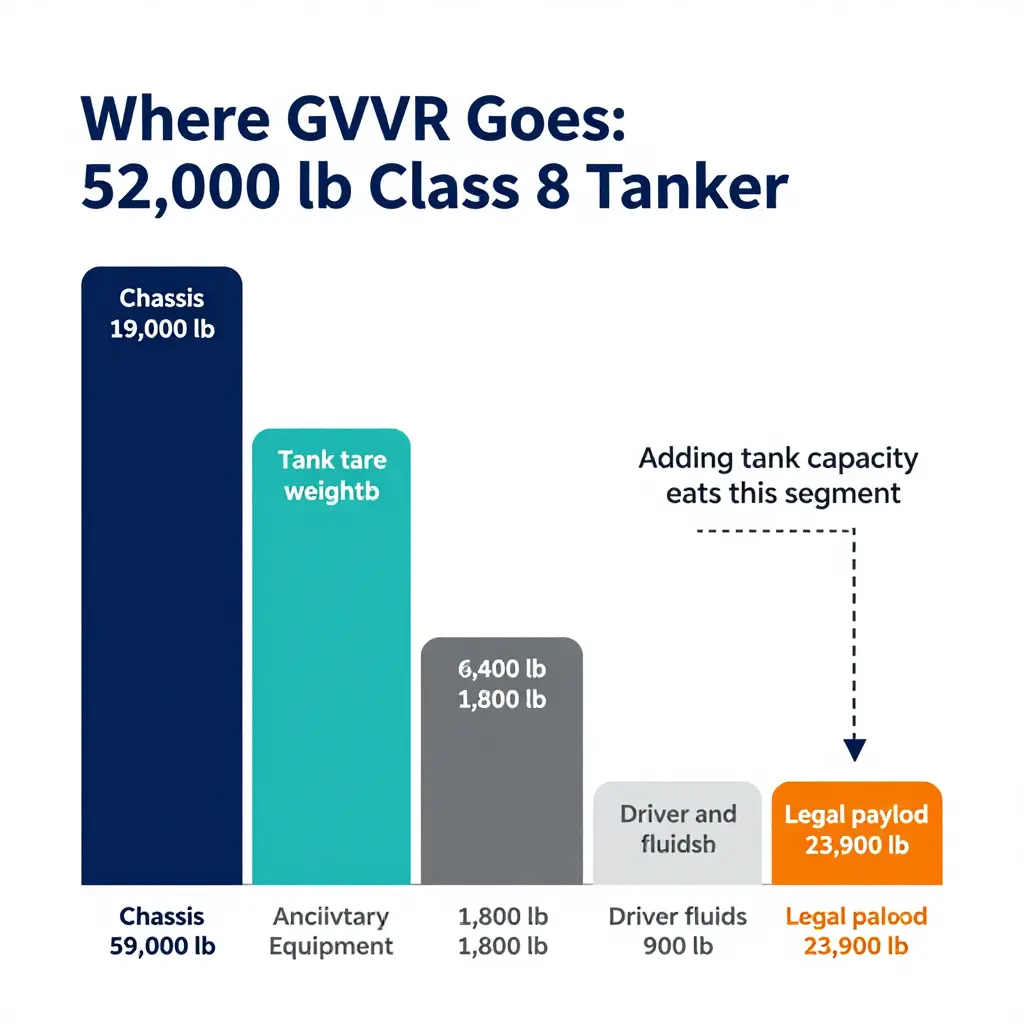
Legal payload is what remains after the vehicle pays for itself. Start with the GVWR, then subtract the chassis (cab, frame, drivetrain, axles, wheels), then the empty tank, then everything bolted to it (pump, PTO, hoses, meters, heating coils, baffles, cabinet), and finally the driver plus fuel, coolant, oil and tools. Whatever is left is cargo.
Legal Payload = GVWR − Chassis − Tank Tare − Ancillary Equipment − Driver & Fluids

Weight-limited condition:   Tank Volume × Cargo Density  >  Legal Payload
Volume-limited condition:   Tank Volume × Cargo Density  ≤  Legal Payload

Payload Index = Legal Payload ÷ Total Vehicle Mass Moved

Marginal payload from extra capacity:
   ΔPayload = (ΔVolume × Cargo Density) − ΔTank Tare   →  becomes ≤ 0
   Capacity stops adding payload at:
   V* = (GVWR − Chassis − Ancillary Equipment − Driver & Fluids)
        ÷ (Cargo Density + Tank Tare per Gallon)
Work a 52,000 lb GVWR tandem-axle tanker. Chassis 19,000 lb; a 4,000-gal insulated steel tank at roughly 1.6 lb per gallon of tare, about 6,400 lb; ancillary equipment 1,800 lb; driver and fluids 900 lb. 52,000 − 19,000 − 6,400 − 1,800 − 900 leaves 23,900 lb of payload. Note how much room the tank and its hardware took: the shell alone is the single largest discretionary block of weight on the vehicle.
Density decides which limit bites first
A truck is volume-limited when it runs out of tank space before it runs out of legal weight, which is typical of low-density loads. It is weight-limited when it hits GVWR with empty space still in the tank. Cargo density is the switch between the two, and it is unforgiving: at 8.34 lb/gal, water packs weight far faster than gasoline at roughly 6.1 lb/gal.
Using the same 21,700 lb of fixed weight (chassis, ancillaries, driver, fluids) against water:
| Tank Capacity (gal) | Tank Tare (lb @ 1.6 lb/gal) | Weight Left for Cargo (lb) | Legal Payload, Water (lb) | Status |
|---|---|---|---|---|
| 2,000 | 3,200 | 27,100 | 16,680 | Volume-limited |
| 3,000 | 4,800 | 25,500 | 25,020 | Volume-limited |
| 4,000 | 6,400 | 23,900 | 23,900 | Weight-limited |
| 5,000 | 8,000 | 22,300 | 22,300 | Weight-limited |
| 6,000 | 9,600 | 20,700 | 20,700 | Weight-limited |
| 7,000 | 11,200 | 19,100 | 19,100 | Weight-limited |
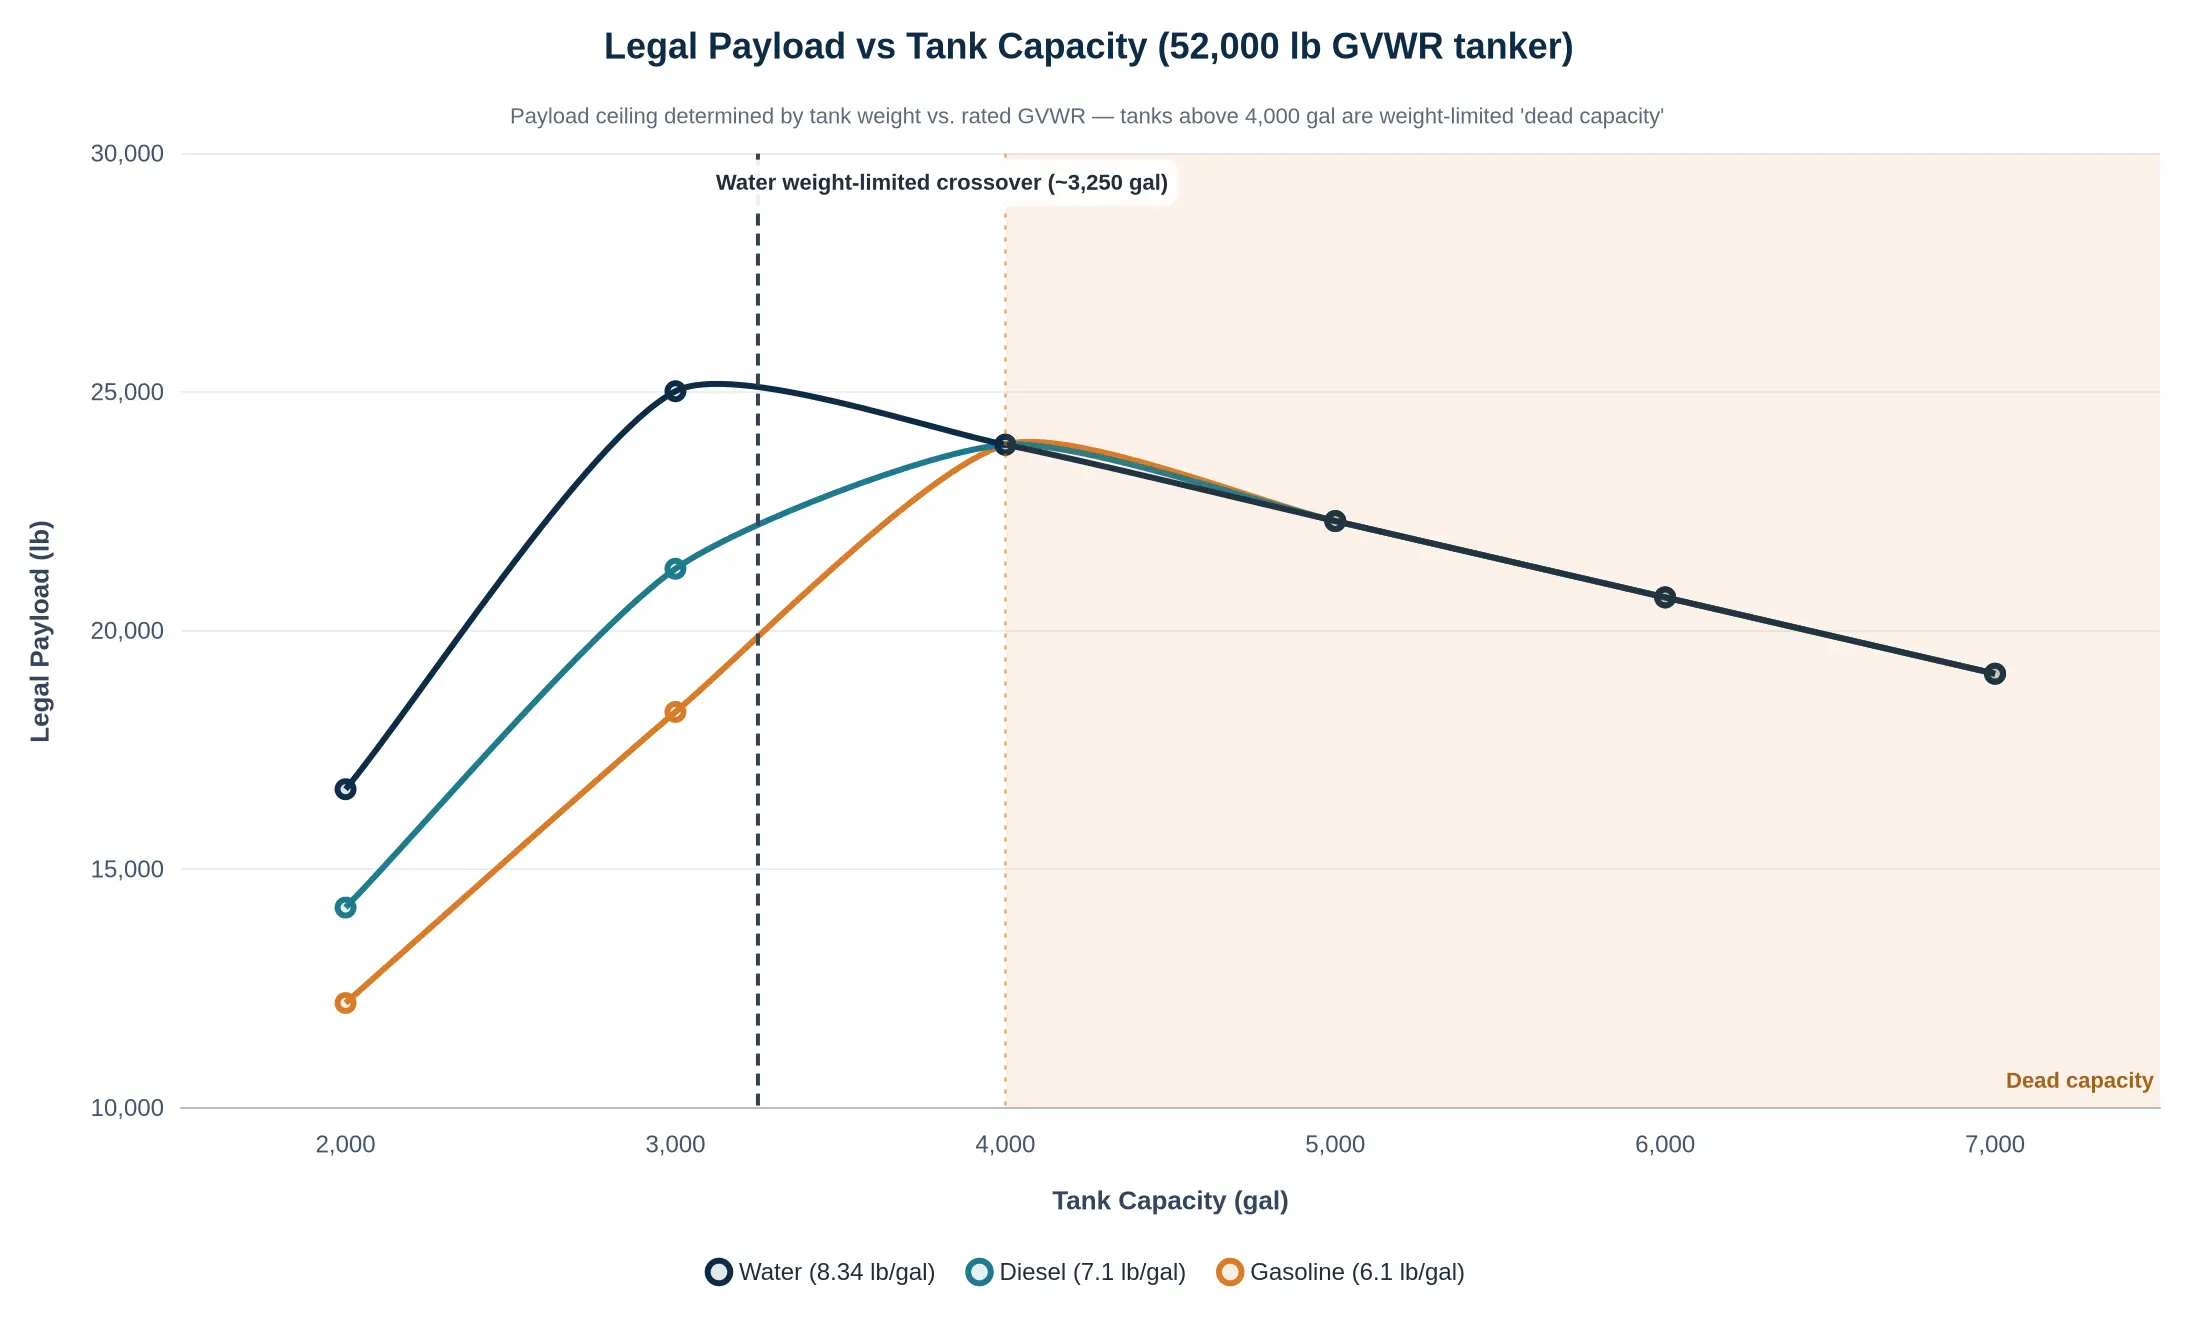
The table shows where extra volume stops paying. At 3,000 gallons the truck is still volume-limited, carrying 25,020 lb in 3,000 gallons of shell. Payload peaks near 3,050 gallons at about 25,400 lb and then falls; by 4,000 gallons it is 23,900 lb, 1,120 lb less than the 3,000-gallon unit. Against a 5,000-gal unit, the 7,000-gal tank carries 3,200 lb less per trip. This is why nameplate ratings, including the figures in this guide to how many gallons a commercial tanker truck can hold, are only half the specification. The payload index says the same in one number: the 4,000-gal truck converts 46% of the mass it moves into billable cargo (23,900 ÷ 52,000), the 7,000-gal truck 37% (19,100 ÷ 52,000).
Where capacity stops paying
Once a vehicle is weight-limited at its working density, any tank volume beyond V* adds zero payload, and every additional pound of tank tare beyond that point removes a pound of cargo. Run the formula above on the example and V* comes out at about 3,050 gallons for water and about 3,900 gallons for gasoline at 6.1 lb/gal. Past that, extra capacity buys refuelling convenience and nothing else, so it has to be justified by saved stops rather than by cargo. That trade usually favours the larger tank only where trip frequency and distance make refuelling a real constraint, not where dense cargo and short hauls already keep the truck pinned to the scale.
The table below puts numbers on it: somewhere around 5,500 gallons of nominal shell, extra capacity stops buying delivered product and starts buying only refuel-stop savings.
| Nominal capacity (gal) | Estimated tank tare (lb) | Payload per trip at 10.0 lb/gal (lb) | Limit flag (delivered load) | Trips for 1,500,000 gal/yr | Refuel stops per 1,000 mi | Opportunity cost per trip vs. smallest option |
|---|---|---|---|---|---|---|
| 3,500 | 3,800 | 35,000 | Volume-limited (3,500 gal) | 429 | 1.52 | $0 (reference) |
| 4,500 | 4,600 | 45,000 | Volume-limited (4,500 gal) | 334 | 1.21 | $0 |
| 5,500 | 5,400 | 50,600 | Payload-limited (5,060 gal) | 297 | 1.01 | $198 |
| 6,500 | 6,200 | 49,800 | Payload-limited (4,980 gal) | 302 | 0.91 | $684 |
| 7,500 | 7,000 | 49,000 | Payload-limited (4,900 gal) | 307 | 0.83 | $1,170 |
Illustrative modelling assumptions, not manufacturer specifications: 10.0 lb/gal product density (mid-density industrial liquid); 80,000 lb GVW limit with 24,000 lb chassis/tractor tare, leaving roughly 56,000 lb for tank plus payload; tank tare scaled at about 0.93–1.09 lb per gallon of nominal shell capacity; fixed annual volume of 1,500,000 gal; 5.5 mpg with 120–220 gal usable fuel capacity by spec tier; net freight margin of $0.45 per gallon applied to unusable (dead) tank volume to derive the opportunity-cost column. Replace these inputs with your own scale tickets and OEM weight sheets before committing capital.
Read the last two columns together. The 7,500-gal configuration shaves 0.69 refuel stops per 1,000 miles, but it carries 2,600 gallons of shell it cannot fill and needs ten more trips a year than the 5,500-gal unit. That is the kind of mispriced tradeoff explored in this analysis of the opportunity cost of a larger tank.
The Real Cost of a Refuel Stop
A stop at the pump or at the loading rack is almost never priced as a stop. It is priced as fuel or as product, which is why the line item looks cheap and the operation feels expensive. Price the stop itself, component by component, then multiply by the stops a year the fleet actually avoids.
Transit Deviation to the Supply Point
Few refuel stops happen exactly on the route. The deviation costs miles and minutes: extra miles divided by average speed, multiplied by the vehicle’s operating cost per hour. Fuel burned on the detour belongs here too, not in the fuel budget, because the detour exists only because of the stop.
Queue and Dispensing Dwell Time
Dwell time runs from arrival at the supply point to departure, and it is usually longer than the transfer itself. Bay congestion, card authorisation, paperwork and metering all consume clock time. On busy corridors queue time can exceed dispensing time, and it is the least controllable part of the stop.
Driver Labour During the Stop
The driver is paid for the stop whether or not the wheels turn. Use the fully loaded rate, base wage plus benefits and payroll burden, which commonly runs 25 to 40 percent above the headline hourly figure. That burden is large enough that labour is usually one of the bigger components, and it is the component most sensitive to market conditions.
Idle Fuel Burn
Idling in a queue or during a transfer burns fuel with no revenue miles attached. The burn rate depends on engine size, ambient temperature and accessory load, and a smaller tank forces more of these events per month. Understanding how fuel tank capacity on semi trucks interacts with winter idle time helps separate controllable idle from unavoidable idle. Tank capacity therefore sets not only range but the frequency of the whole cost bundle described here.
Scheduling Buffer Absorbed into the Dispatch Plan
Planners protect on-time performance by padding routes with slack. That slack is capacity the fleet paid for and cannot sell. A 45-minute buffer added to absorb a refuelling event is a cost of the stop, and it stays invisible because it never appears as a charge.
Lost Asset Utilisation on the Fixed-Cost Side
Depreciation, financing, insurance, permits and telematics keep accruing while the truck stands still. Fixed cost per hour equals monthly fixed cost divided by billable hours available. Multiply by stop hours and the result is often comparable to the fuel burned. Fleets underestimate this component more consistently than any other, because it never shows up on an invoice.
| Cost component | What drives it | How to quantify it |
|---|---|---|
| Transit deviation | Out-of-route miles and average road speed | Extra miles / average speed x operating cost per hour |
| Queue and dispensing dwell time | Site throughput, bay availability, payment and paperwork steps | Arrival-to-departure minutes minus productive transfer minutes |
| Driver labour | Loaded wage rate including benefits and payroll burden | Stop hours x fully loaded labour rate |
| Idle fuel burn | Idle hours, ambient conditions, accessory load | Idle hours x idle gallons per hour x fuel price |
| Scheduling buffer | Slack added to protect on-time delivery | Buffer hours x operating cost per hour |
| Lost asset utilisation | Fixed cost per hour of the vehicle | Fixed cost per hour x stop hours |
Converting Saved Stops into an Annual Figure
Sum the six components to get a cost per stop, then annualise:
Annual value of avoided stops = stops avoided per month × cost per stop × 12
Net out the offsets before you rely on the number: any payload reduction per trip, the capital premium of the larger tank, and the interest or lease cost on that capital. What remains is the opportunity value of an eliminated stop, and it is the figure to compare against the cost of additional capacity.
Why the Same Saved Stop Is Worth More on Some Fleets
Cost per stop scales with the driver wage rate and the fixed asset cost per hour. The same stop that costs one operation a modest amount can cost another several times as much for the identical duration, because labour is dearer and the equipment carries a higher fixed-cost burden. High-wage, high-utilisation operations can therefore pay more for capacity that removes stops. Low-wage, low-utilisation ones should stay disciplined about capacity they cannot keep productively employed.
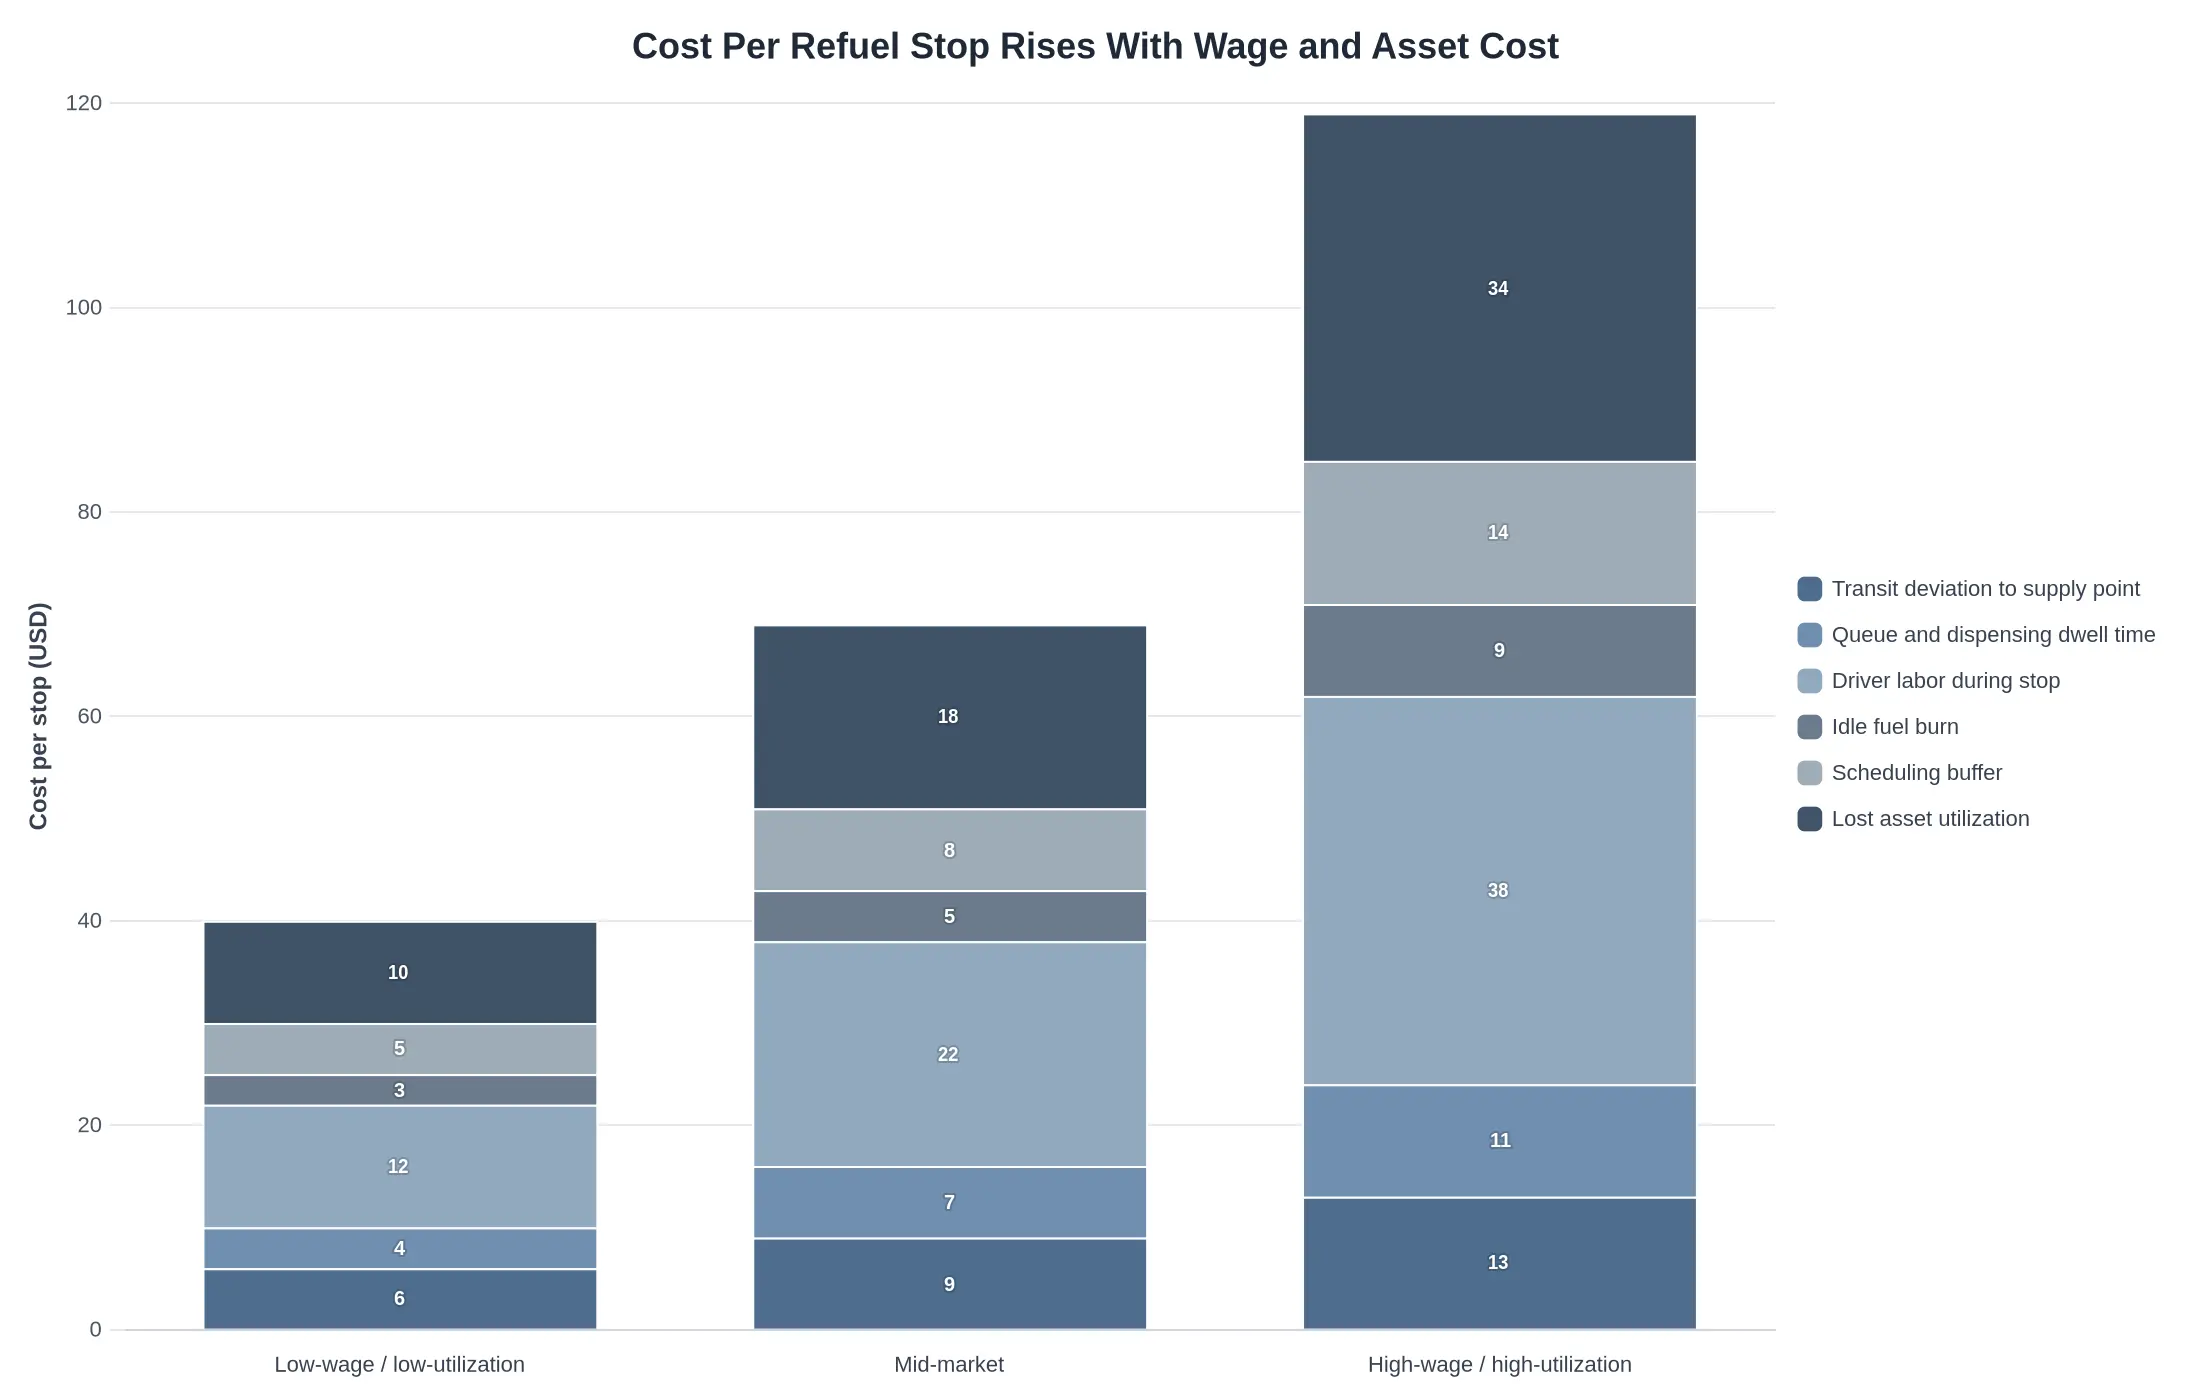
Every component grows across those profiles, but driver labour and lost asset utilisation grow fastest, which is where the case for fewer stops is strongest.

Both timelines cover the same total route distance, so any difference between them is pure overhead. The upper bar runs load, transit, stop, return with nothing in between. The lower one tells the more common story: an unplanned refuel stop spliced into the middle of the cycle, pushing every later segment to the right, shortening the productive part of the route and returning the driver to the yard later than planned. The extra gallons buy the eliminated sliver in the lower bar. The extra tank weight costs revenue-earning capacity on every one of those trips.
Variables That Move the Break-Even Point
The break-even point of a larger tank is not a fixed number. It drifts whenever an input in the operating model changes, and the direction of the drift differs by fleet. Before locking in tanker truck specifications, work through the variables below and ask which way each one pushes your operation.
- Route length between supply points. Long hauls reward capacity, because a tank that skips a stop on a sparse corridor saves real hours. Short urban loops generally favour the smaller tank.
- Diesel or product price. Rising prices favour the larger tank, since fewer stops mean fewer purchases at premium roadside prices. Soft prices make the payload penalty of extra capacity harder to justify.
- Delivery frequency per month. High trip volumes favour the smaller tank, because the payload loss repeats on every load. Low-frequency routes give a large tank time to amortise its weight penalty.
- Driver wage and labour availability. Rising hourly wages favour capacity that cuts paid downtime at the pump. Chronic driver shortages push the same way, since saved hours outweigh lost payload.
- Cargo density. Dense cargo favours the smaller tank because axle limits bind well before the shell fills. Light cargo such as gasoline or solvents can keep a larger tank full and earning.
- Toll and permit cost per trip. High per-trip tolls favour fewer billed crossings; cheap flat-rate routes tilt the maths back toward the smaller tank.
- Tank tare weight. Thick shells or insulation steal payload and favour the smaller tank. Lightweight builds free up gross weight for product.
- Axle and bridge weight limits. Tight limits cap usable volume, which favours the smaller tank. Generous limits let a larger shell fill without waste.
- Seasonal demand swings. Sharp peaks favour payload per trip. Flat year-round demand favours a larger tank amortised across steady loads.
- Residual resale value. Strong resale on common sizes favours a smaller or mid-size tank; a thin buyer pool for oversized units raises the opportunity cost of going big.
Why the Variables Only Matter Together
No single variable decides the outcome, and treating one of them as a verdict is how fleets end up with the wrong tank. A long route argues for extra capacity, but if the cargo is dense and bridge limits are tight, that larger shell carries air instead of product. High trip frequency argues for a smaller tank, yet a network of cheap toll-free routes may still make the big unit cheaper per gallon delivered. Wages, resale strength and seasonal swings interact the same way, sometimes cancelling out and sometimes compounding. Model the whole set at once, weight each variable by how often it occurs on your lanes, and recheck the break-even point whenever fuel prices, labour costs or route structures shift. Build the specification around that combined picture, not around one impressive number on a spec sheet.
Where the Cost Curves Cross: Annual Total Cost by Tank Capacity
Two costs move in opposite directions. A bigger tank carries more liquid per trip but adds weight that steals payload, and the loss is paid on every load. A smaller tank protects payload but forces more refuel stops, more driver hours at the pump and more schedule friction. The chart below nets both against five nominal capacities, from 3,500 to 7,500 gallons.
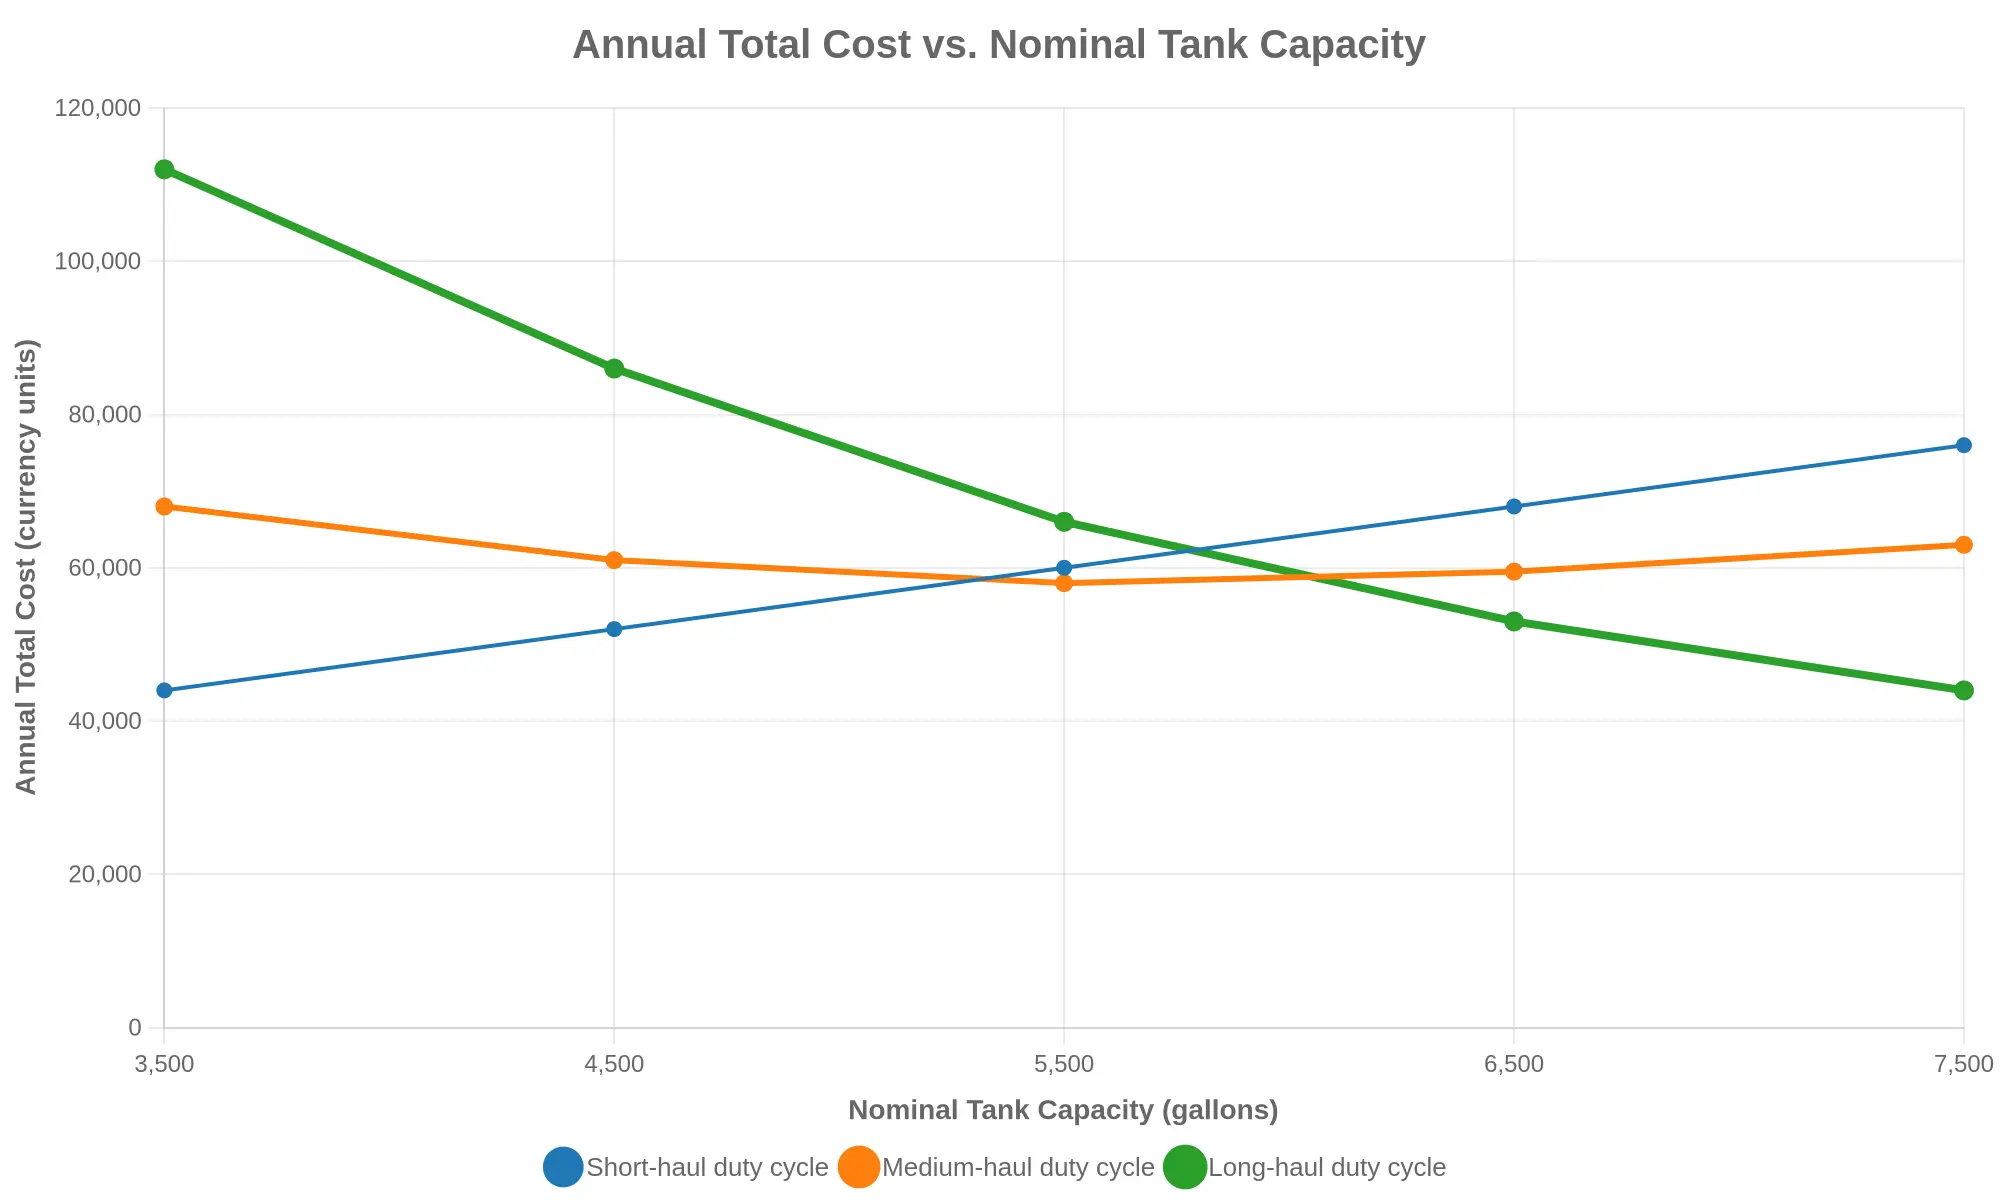
Annual total cost by nominal tank capacity. The optimal capacity shifts upward as route distance between supply points increases.
Reading the Three Curves
The short-haul curve (dashed, circular markers) climbs almost linearly with capacity, because on tight routes the extra weight is dead cost and refuel stops were never the bottleneck. The long-haul curve (solid, triangular markers) does the opposite, falling sharply as capacity grows, since each avoided stop on a 600-mile run compounds across the year. The medium-haul curve (dotted, square markers) is the shallow U that mixed-duty fleets live on, bottoming out in the mid-5,000-gallon range.
- Below roughly 4,800 gallons, the long-haul curve is the highest cost line, which means a big tank is paying for itself.
- Between 4,800 and 5,800 gallons, all three curves converge. This is the crossover zone where small specification changes flip the answer.
- Above 6,500 gallons, the short-haul curve becomes the expensive option, and the penalty is pure payload opportunity cost.
If you are weighing that payload penalty against stop frequency in more detail, our breakdown of the opportunity cost of a larger tank walks through the per-trip maths behind these curves.
There is no universally “right” tank size, only a right size for a duty cycle. Pull twelve months of route data and map your own stop density onto these three shapes before you lock a spec. The crossover usually sits closer to your current capacity than expected, sometimes just one step above it.
Footnote: figures are illustrative modelling output built for comparison, not live operational data. Actual costs vary with fuel prices, terrain, payload regulations and driver wage rates.
Gross Vehicle Weight, Axle Loads, and the Legal Ceiling
The usable size of a tanker is decided by the truck underneath it, not by the tank. Legal payload ceilings come from two numbers working together: the gross vehicle weight rating of the completed vehicle, and the per-axle load limits it must respect on the routes you run. Every gallon of tank volume above that ceiling is carried as tare, steel you buy, insure, fuel and haul on every trip for no revenue. Past a certain point a bigger tank means a heavier empty truck, not a bigger load.
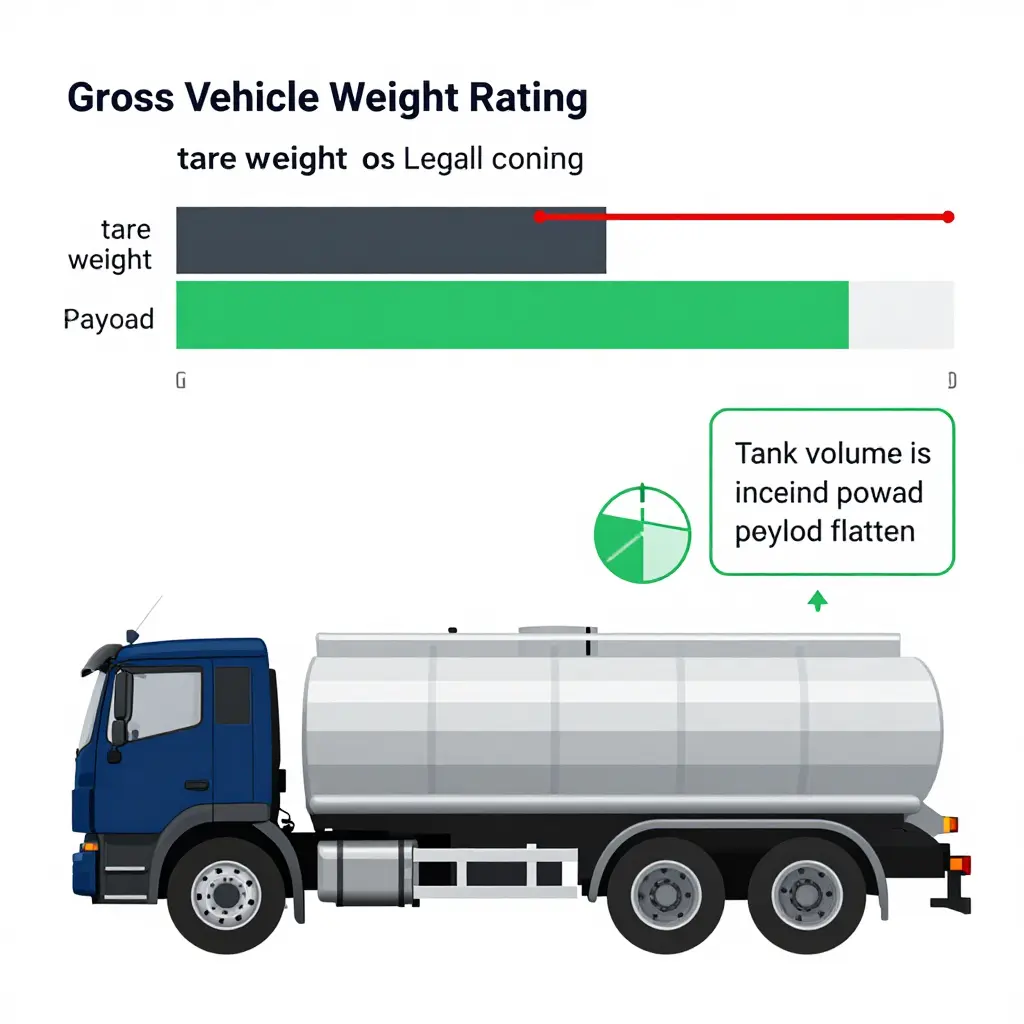
GVWR is a ceiling; axles are the load path
Gross vehicle weight rating is a manufacturer-assigned maximum for the complete vehicle, chassis, tank, fluid, driver and accessories included, and it is enforced at the scale rather than in the brochure. Compliance does not stop at the total. A truck can sit comfortably under GVWR and still be illegal or unsafe because one axle is overloaded.
That is where axle spacing and load distribution take over. Spacing between the steer axle and the rear group determines how much of the load each axle group is credited with carrying, and bridge-formula enforcement in many jurisdictions penalises closely spaced axles. Liquid loads make this harder still: fluid shifts forward under braking and rearward under acceleration, so a static scale ticket is not the whole story. Baffles and internal compartment divisions keep that shift inside a predictable envelope and let you load compartments selectively to tune the weight split. A tank with undersized baffles, or one long unbaffled compartment, can put you over an axle limit on a downhill grade with a load that weighed legal in the yard.
Weight is cheaper to check before the order than at a weigh station. Buyers who leave it as a paperwork detail usually meet it at the first scale they cross.
The structural side is equally unavoidable. Capacity is not free volume. A larger tank needs thicker shell and head plate, heavier baffles, more reinforcement at the mounting points and often a longer or heavier chassis to carry it, all before a single litre of product goes in. Weight rises roughly in step with capacity, so payload grows more slowly than tank volume and eventually stops growing. Denser products shrink the usable volume for the same weight limit, which is why a tank sized on litres alone can be badly oversized for the product it will actually haul.
| Configuration element | What it consumes | What procurement should verify |
|---|---|---|
| Tank shell, heads, and baffles | Tare weight | Empty weight on a certified scale, not a datasheet |
| Tank length and axle spacing | Axle group load split | Bridge-formula compliance for target routes |
| Compartment count and layout | Ability to trim load distribution | Per-compartment volumes and baffle ratings |
| Product density | Payload capacity in tonnes | Worst-case density, not average |
| Pumps, PTO, hoses, ladders | Tare weight and axle placement | Full operating weight with accessories fitted |
Before the order goes out
Before signing off on tank volume, ask for three numbers: the completed vehicle’s GVWR, its measured tare with all equipment fitted, and the resulting payload at the product density you actually haul. Then check the axle load figures against the jurisdictions you operate in, and check them again for markets you plan to enter, because axle-spacing rules, bridge limits and allowable gross weights differ from one to the next. A configuration validated for one country is not automatically valid for another.
Tie the specification to payload per trip rather than tank size and the economics resolve themselves: the right tank is the largest one that still leaves a full, legal, repeatable load every time. Anything beyond that is tare you pay for on every trip.
Route Profile and Duty Cycle: Where the Decision Is Actually Made
Tank capacity debates usually start in the wrong place. Teams compare litre figures, curb weights and price sheets before anyone has written down the work the truck will actually perform. Reverse the order: document the route profile first, quantify the duty cycle second, and only then open the sizing spreadsheet.
Step 1: Document the duty cycle in numbers
Capture six measurements for every loop the vehicle will run. Record average miles between supply points and, separately, the maximum, because the gap between the two is where the risk lives. Count delivery drops per loop, since each adds fixed time and spill risk but no distance. Log hours-of-service exposure against realistic drive times: queue time eats into the 14-hour on-duty window without adding miles, and the 11-hour driving limit caps the day. Measure queue exposure at loading terminals in minutes per load. Plot seasonal volume variation across the year, since a route that runs light in February and heavy in August will punish a decision made in either month alone. Fuel, water and septic work all differ, so rebuild this baseline per fleet rather than borrowing a competitor’s.
Step 2: Convert the baseline into stops avoided and payload retained
The second step translates the route profile into two competing currencies. On one side sits the number of refuel stops eliminated per loop and the hours those stops recover. On the other sits payload surrendered per trip, as a percentage of usable capacity and in units not delivered per period. Short-trip, high-frequency work, municipal water delivery or multi-drop septic service for instance, almost always resolves toward retaining payload, because refuel intervals already exceed the length of a loop: a bigger tank saves minutes the schedule never needed while taxing every load. Long-haul runs between distant supply points behave the other way, because each incremental litre converts into a stop avoided, and a stop at a remote terminal can consume more time than the payload it displaced.
Step 3: Price the trade and stress-test it against the peak season
Price both currencies in the same units. Multiply recovered hours by the fully loaded hourly cost of the vehicle and driver; multiply lost payload by trips per period and margin per unit; compare the totals. Then rerun the calculation using peak-season volumes rather than averages. If the advantage holds at peak and at trough, the capacity choice is robust. If it flips, the operation probably needs a mixed fleet: payload-maximising units on dense loops, larger tanks reserved for long-distance, low-drop work.
Run across a fleet, the sequence produces a specification and a written rationale that survives procurement review. It also reframes the question: not how much liquid a truck can carry, but how much of that capacity the route profile will actually pay for.
Where the Money Actually Goes: Annual Cost Impact Composition
A capacity decision rarely shows up as a single line item. It arrives as a bundle of costs moving in different directions, and what matters is how they net out over twelve months of operation.
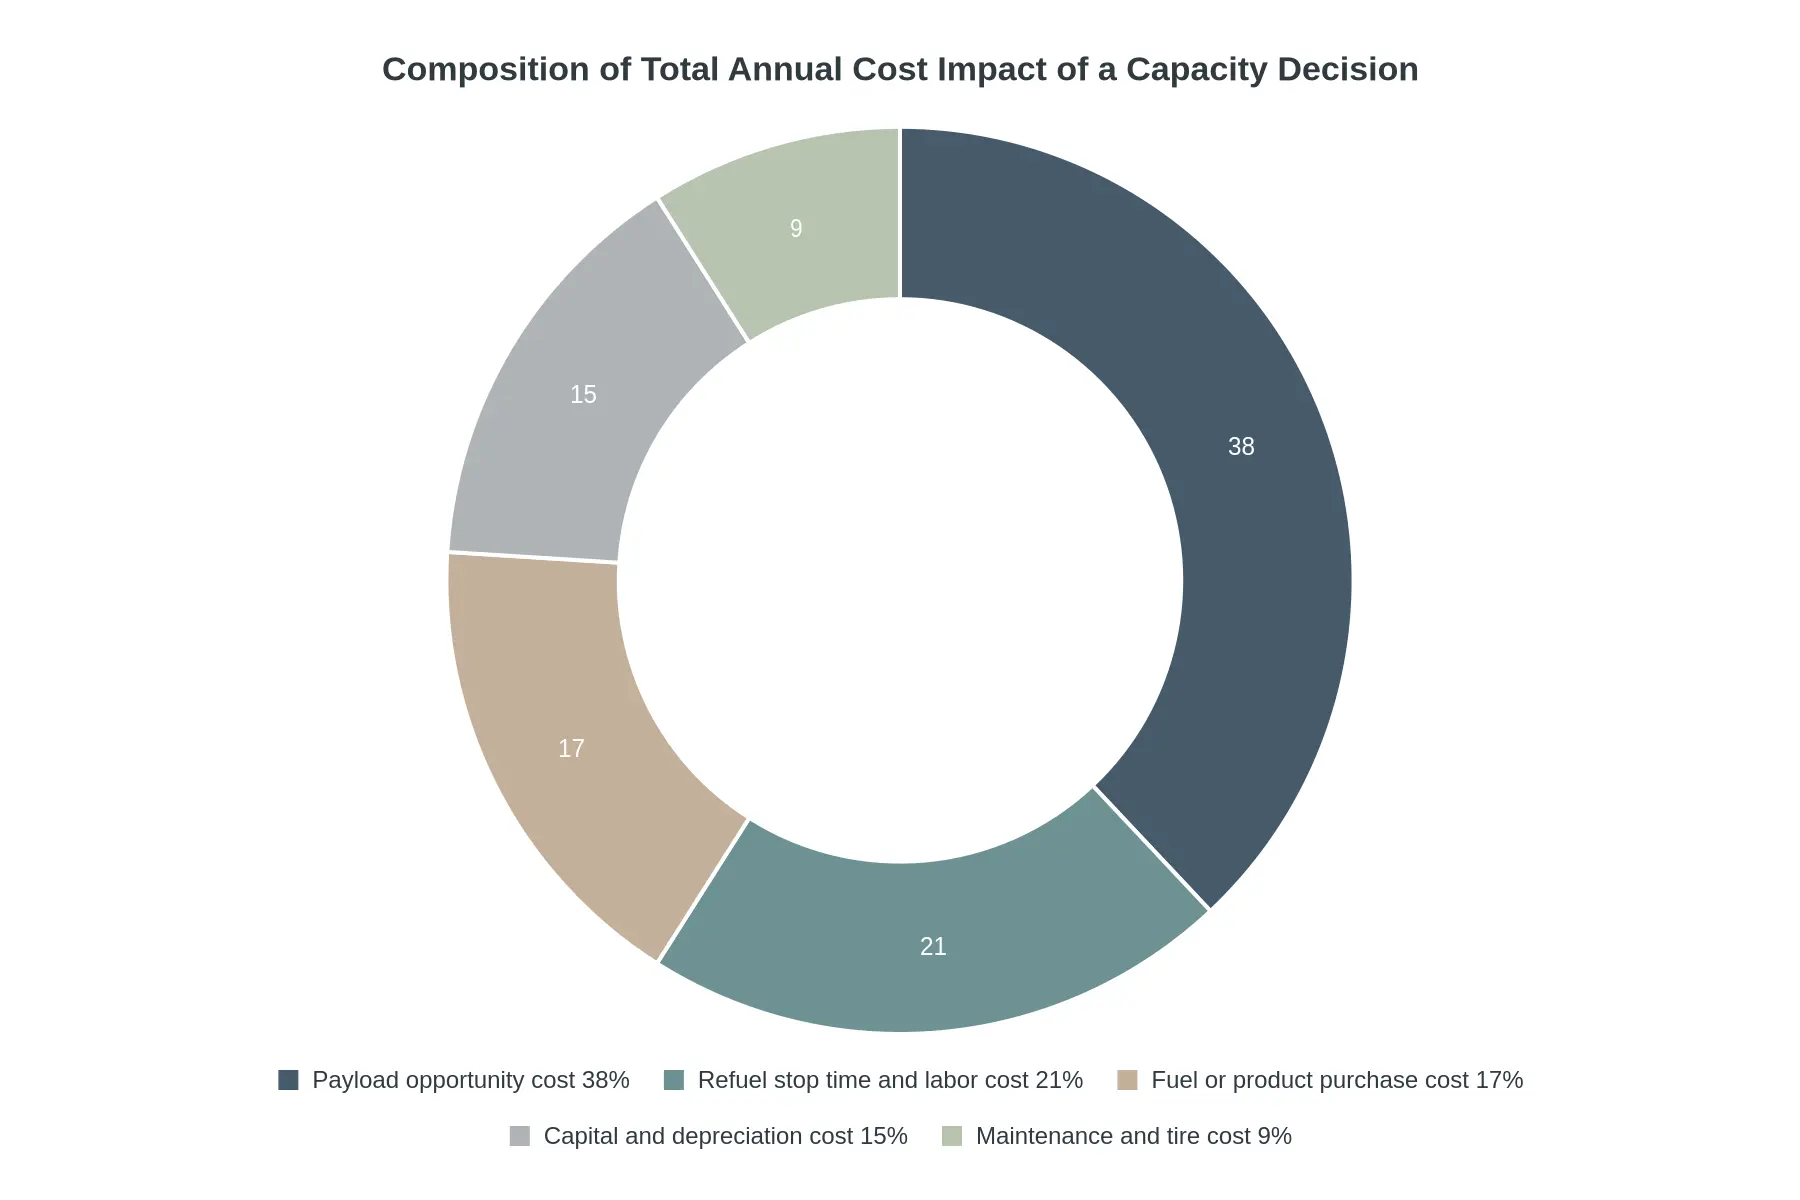
Illustrative split of total annual cost impact across five categories, each labelled as a share of the whole. Payload opportunity cost is the largest single component of the annual cost impact when cargo is weight-limited.
Reading the Chart
- Payload opportunity cost (38%) dominates because every kilogram of tank and fuel weight that cannot be sold as payload is revenue forgone on every load, all year. This is the category that quietly erodes margin in weight-limited operations.
- Refuel stop time and labour cost (21%) captures the driver hours, idle time and scheduling slack consumed by extra fuel stops, which is what you buy when you trade payload for range.
- Fuel or product purchase cost (17%) reflects the working capital tied up in carried inventory rather than delivered product.
- Capital and depreciation cost (15%) grows with tank size: purchase price, financing charges, write-down.
- Maintenance and tyre cost (9%) is smaller but not trivial, since heavier running weights accelerate tyre and component wear.
Read together, the chart makes the trade concrete: the savings from fewer refuel stops sit in a 21% bucket, while the cost of carrying the extra capacity sits in a 38% bucket. How that gap is calculated load by load is set out in our analysis of the opportunity cost of a larger truck tank, which pairs this composition view with per-trip payload maths.
Footnote: The shares shown are illustrative and are not drawn from a single fleet’s ledger. Actual percentages will shift with route length, wage rates and commodity density. A weight-limited operation on long hauls will load the payload share more heavily; a short-haul operation where stops are the real constraint will load labour and stop time instead.
Cargo Density and Compartment Layout Change the Payload Math
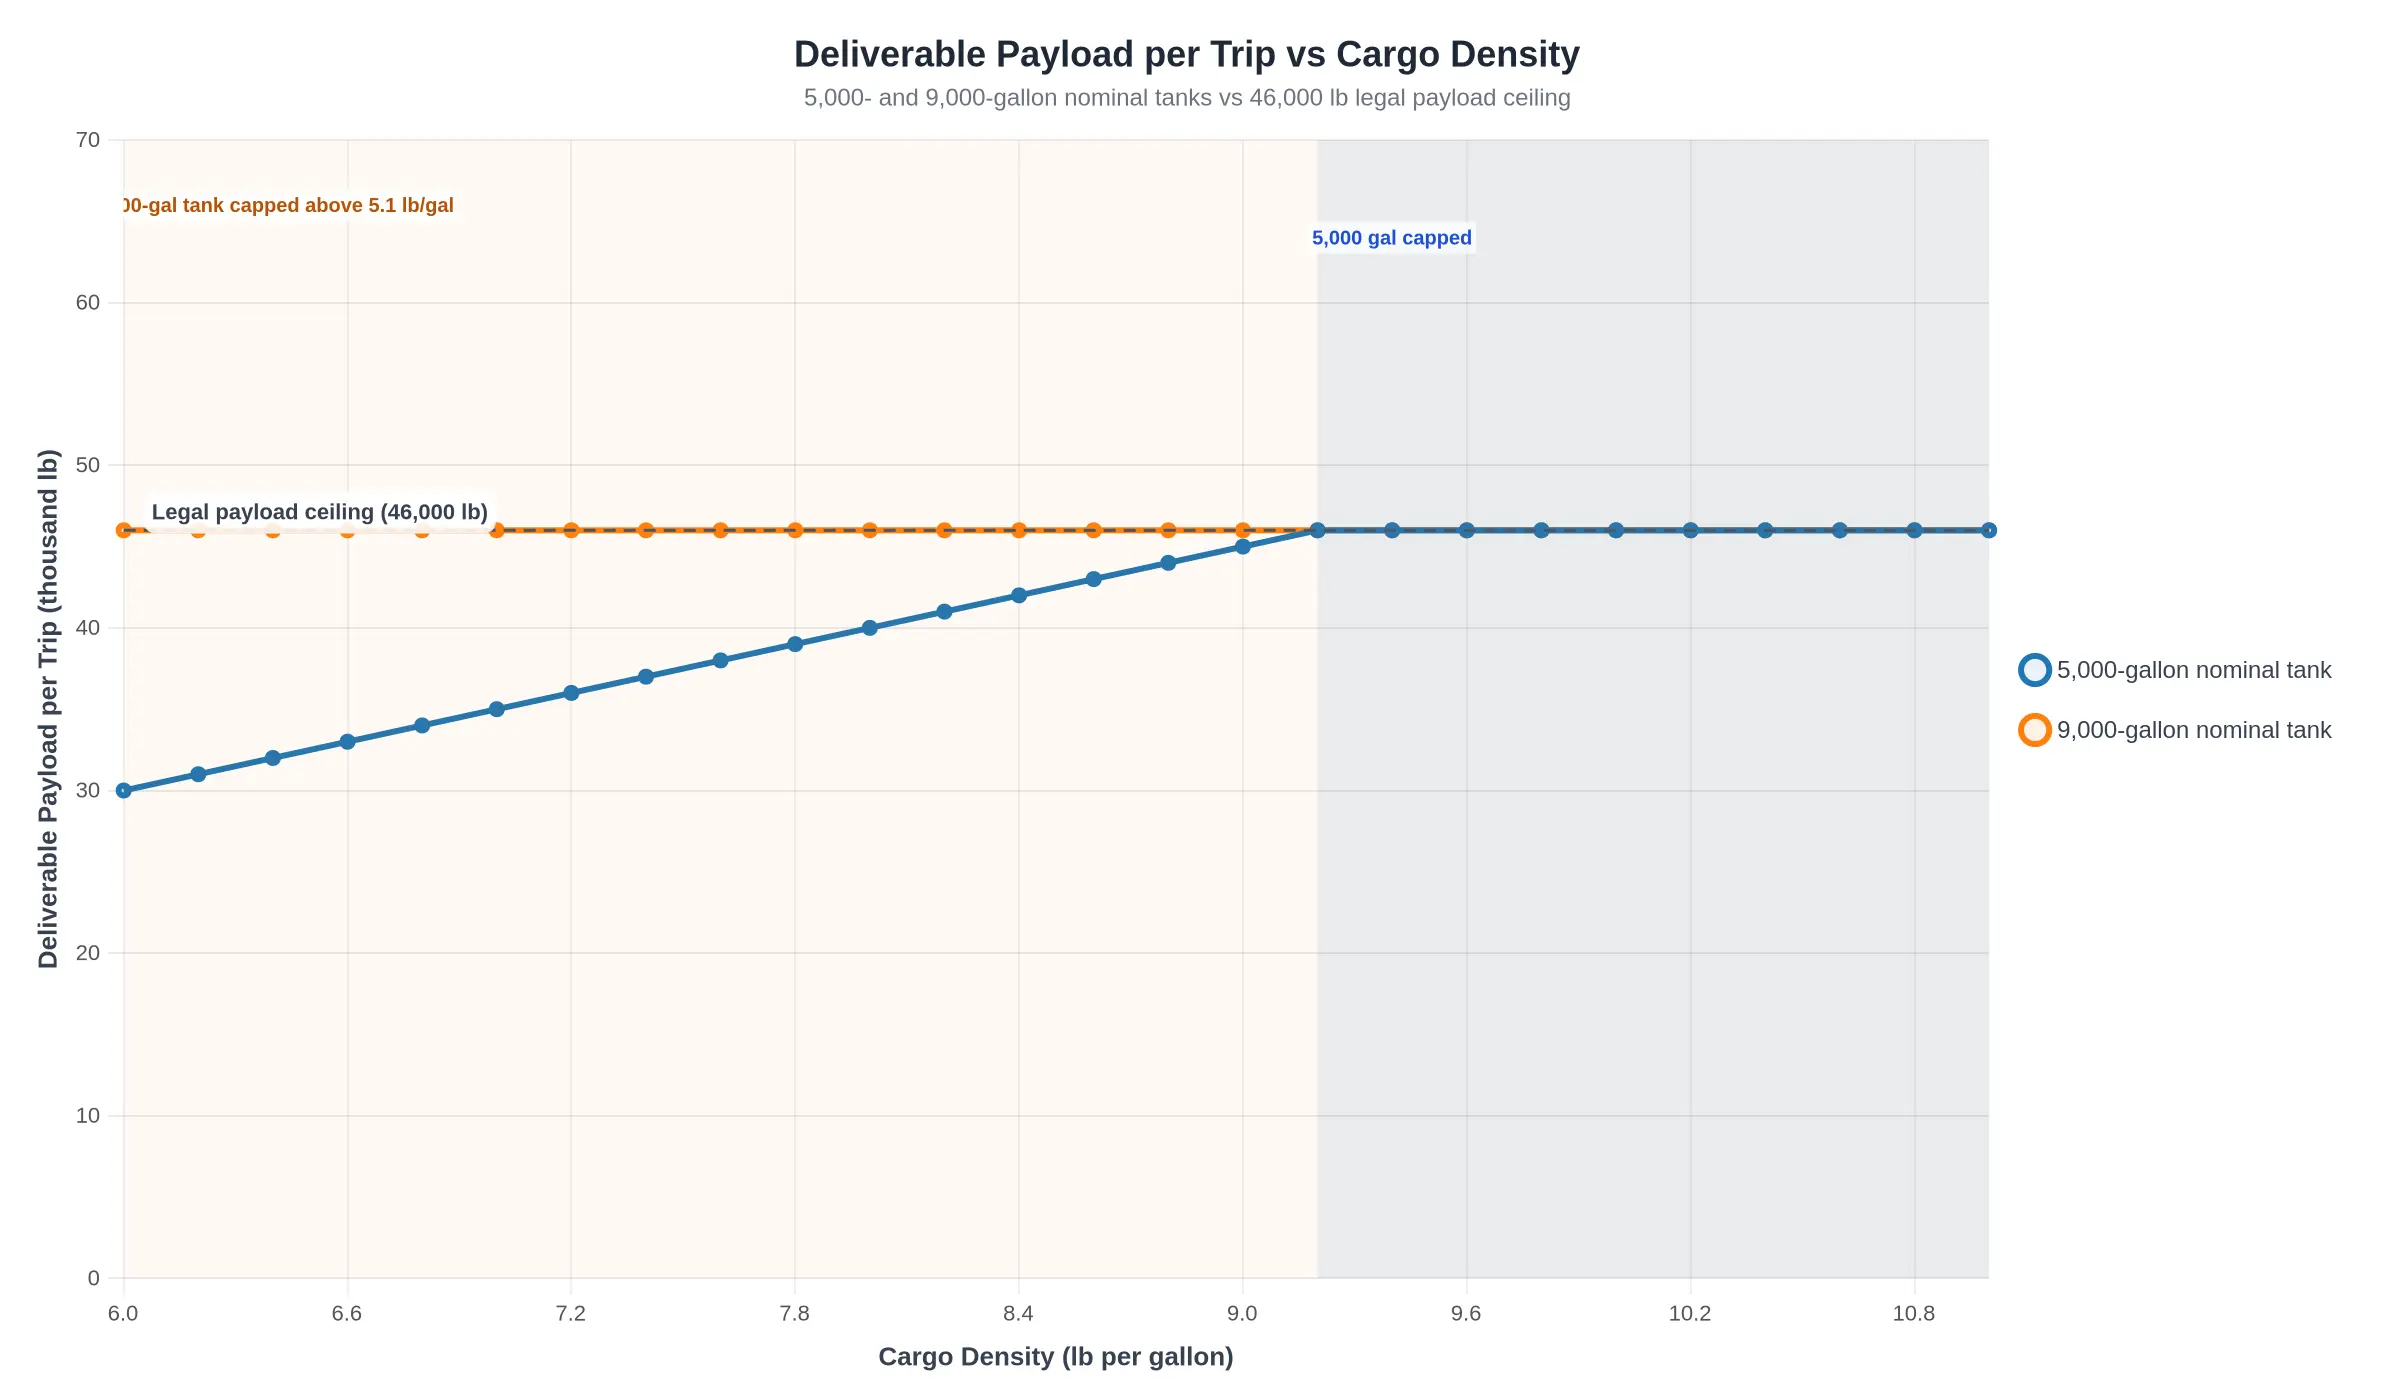
Two fleets can quote the same tank capacity and earn very different revenue per run, because a tank is not a fixed unit of freight. It is a container whose delivered value depends on what you pour into it. Cargo density sets the ceiling on how much of the shell you can legally use; compartment configuration decides how much of that shell is genuinely reachable; together they determine the payload loss per trip attached to any size decision.
Volume-Limited or Weight-Limited: Which Constraint Binds?
Every load resolves to the lower of two numbers:
- Volume path: usable volume × cargo density = payload the shell can physically hold.
- Weight path: gross vehicle weight rating minus tare, fuel, driver and equipment = legal payload allowance.
If the volume path lands below the weight allowance, the tank is volume-limited, and light product leaves legal weight capacity unused. If the volume path exceeds the allowance, the tank is weight-limited, and part of the shell becomes ballast. The crossover density is the payload allowance divided by usable volume. A 9,000-gallon shell with a 46,000 lb allowance stops filling at roughly 5.1 lb/gal, while a 5,000-gallon shell of identical construction keeps filling until about 9.2 lb/gal. That single ratio explains why a larger tank is a productivity gain for light cargo and a decoration for dense cargo.
Because published figures follow different capacity measurement conventions, nominal versus usable, dome space, fill limits, the denominator in that calculation is easy to misread. For a practical breakdown of how those conventions are applied, see this guide to oil tanker truck capacity in the U.S..
What Compartments and Baffles Take Back
Compartmentalisation is an operational convenience with a measurable volumetric cost. Each transverse baffle and partition consumes shell length, each compartment carries its own ullage allowance (often 2–5 percent), and heels or undeliverable residue sit at the bottom of every chamber. More compartments therefore mean slightly less usable volume for the same nominal volume, plus more fill points to monitor.
Baffle placement then governs fill limits and axle loading. Compartments are positioned to spread mass across axles, so the constraint on a multi-drop run is usually per-compartment weight rather than total weight. An operator can be forced to run a compartment partly empty to keep a steer or drive axle compliant, a payload loss that never appears on the tank specification sheet. Bulk liquid transport planning that ignores this sequencing overstates achievable tons per trip.
| Cargo density (lb/gal) | 5,000-gal shell | 9,000-gal shell | Shell volume usable on 9,000 gal |
|---|---|---|---|
| 6.3 – light fuel | Volume-limited, ~31,500 lb | Weight-limited, ~46,000 lb | ~7,300 gal (81%) |
| 8.3 – water | Volume-limited, ~41,700 lb | Weight-limited, ~46,000 lb | ~5,540 gal (62%) |
| 10.5 – dense brine | Weight-limited, ~46,000 lb | Weight-limited, ~46,000 lb | ~4,380 gal (49%) |
Why Identical Tanks Produce Different Losses
Take two operators with the same 9,000-gallon tanks. One hauls light fuel at 6.3 lb/gal and delivers roughly 7,300 gallons per trip; the other hauls dense liquid at 10.5 lb/gal and delivers about 4,380 gallons against the same weight ceiling. The second pays for 9,000 gallons of steel, tyres and depreciation to move fewer than half that volume, and every additional trip multiplies the gap. The payload loss comes from density, amplified by an oversized shell, not from maintenance or routing.
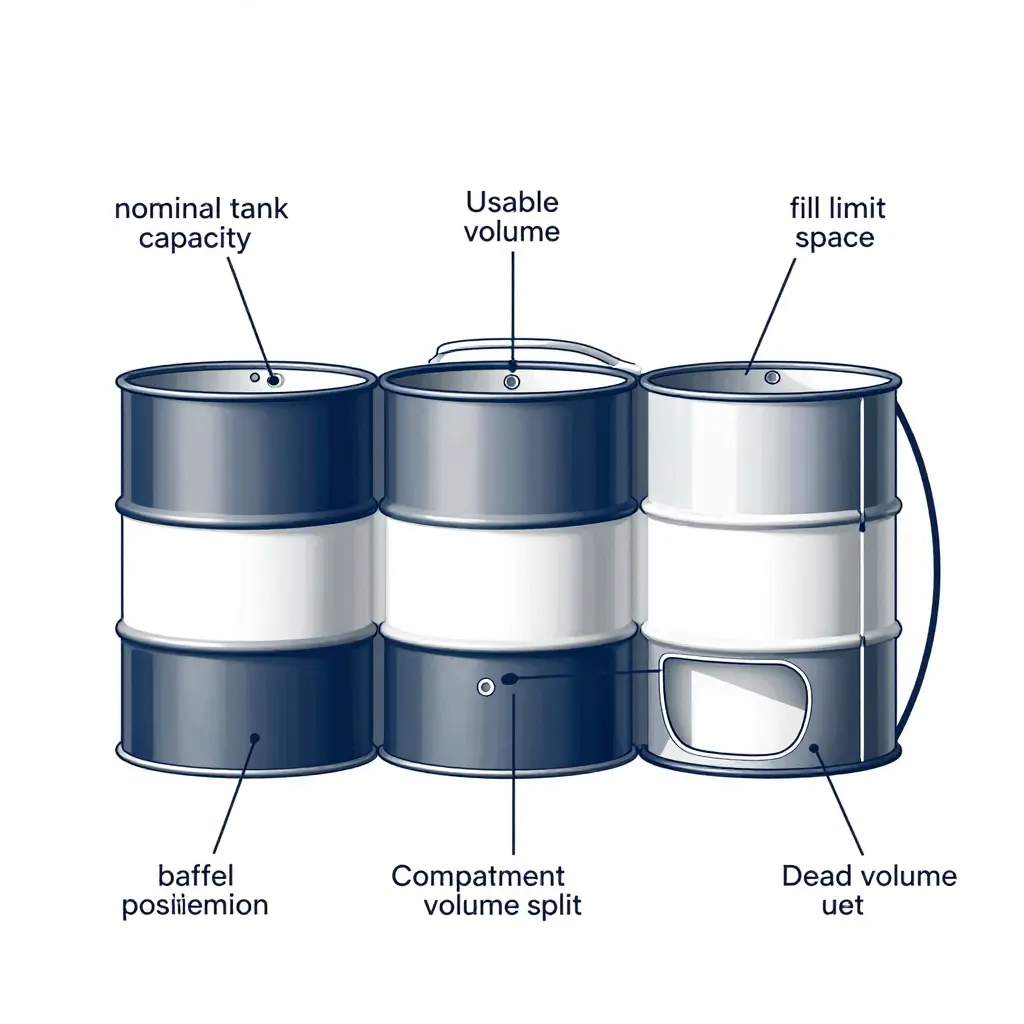
The rule for procurement: match shell volume, compartment count and baffle positions to the density band and delivery pattern you actually run, then test the configuration against the binding constraint rather than the headline gallon figure. Analysis that starts with density, not tank size, is what turns a capacity decision into a defensible payload estimate and a defensible cost per delivered unit.
Where a Bigger Tank Stops Paying You Back
Every capacity decision runs into the legal weight ceiling. Below the threshold a larger tank buys more product per trip, because the cargo is light and the load is bounded by space rather than mass. Above it, additional capacity is dead volume: steel and air hauled against a fixed gross weight limit, with each extra gallon displacing payload you can bill for. The diagram shows that crossover in its simplest form, a rising payload curve, a flat legal ceiling, and the point where one constraint hands over to the other.
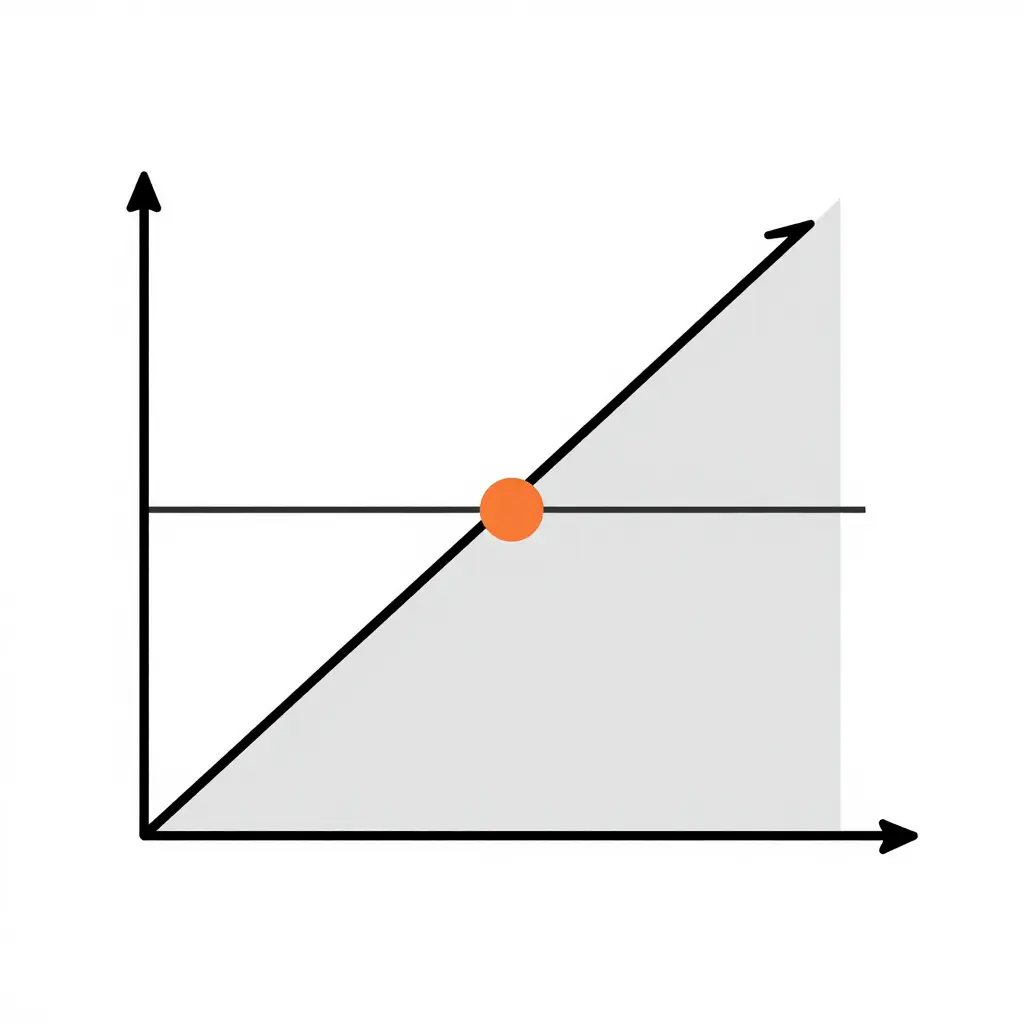
Left of the marked point, capacity still converts into revenue. Right of it, the flat ceiling takes control and the marginal gallon earns nothing. How that trade-off plays out in fleet economics is covered in this breakdown of the opportunity cost of a larger tank.
Specifying the Right Tank Configuration: A Procurement Checklist
Most capacity mistakes are made before a single quote is requested. A buyer decides the tank should be “as large as possible” or “the same as the last truck,” and the specification process simply confirms the assumption. Do it the other way round: operating data first, then tank volume, compartment layout and pump package. A tanker truck supplier needs the information below to size a unit properly, and there are questions worth asking in return.
The seven inputs that drive the decision
Commodity type and density. Volume is not payload. A 2,500-gallon tank of water carries roughly 20,850 lb of product, and the same tank filled with a denser liquid can push a truck over its gross weight rating while still showing empty space at the top. Density, corrosiveness, viscosity and whether the product needs insulation or a heating jacket all change the material specification.
Target payload. State the payload in weight per trip, not gallons, and let the supplier work backward to a usable volume.
Route distance between supply points. Short urban loops and long intercity runs reward different tradeoffs between tank size and fuel or DEF capacity.
Annual volume. This sets the number of trips per year and shows whether a larger tank removes trips or just adds tare weight.
Axle and weight limits for the operating region. Bridge formulas, tandem limits and local enforcement vary, so a configuration legal in one jurisdiction can be overweight in the next.
Loading method. Top fill, bottom loading, pump-off rates, hose diameter and metering requirements all affect fittings, baffles and valve selection.
Service life expectations. Planned years in service and annual mileage drive the choice between standard and heavy-duty builds, and they shape the resale or replacement plan.
Quick reference checklist
| Input | Why it changes the configuration | What to bring |
|---|---|---|
| Commodity and density | Sets material of construction and weight per gallon | Product data sheet, density in lb/gal |
| Target payload | Converts volume into legal weight per trip | Target tons or lb per trip |
| Route distance | Balances tank size against fuel and driver hours | Loaded and empty miles per cycle |
| Annual volume | Determines trips per year and fleet sizing | Gallons per month, peak season notes |
| Axle and weight limits | Constrains tank volume and axle spacing | Regional bridge formula, target GVWR |
| Loading method | Defines fittings, baffles, and pump size | Fill type, flow rate, hose size |
| Service life | Drives duty rating and rebuild strategy | Planned years and annual miles |
Turning the data into a comparison
With those inputs in hand the arithmetic is straightforward. When a denser commodity forces payload loss per trip, a larger tank may carry nothing but structural weight and unusable headspace. Ask for the computed payload in pounds and the projected trips per year for each option instead of comparing sticker gallon figures.
This is where a dealer representing several manufacturers adds practical value. A multi-brand dealer can place two or three build sheets side by side, note where baffling, compartment splits or pump selection differ, and request a custom tank configuration from the factory when no catalogue unit fits. Ask for written confirmation of lead times, certification paperwork, warranty terms and which components are shared across the offered models. It also helps to see how tank size and vacuum pump type split the price before signing, since a lower tank price can be offset by a pump that is undersized for the duty cycle.
Support and parts belong in the cost model
After-sales support and parts availability are not footnotes. Downtime on a tank truck is lost revenue, and a model with a long lead time on a replacement valve or a proprietary pump body carries a real cost even when its purchase price looks competitive. Buyers comparing a tanker truck for sale should ask about service coverage in their region, typical parts lead times and the availability of consumables such as seals, hoses and baffle gaskets. Total cost of ownership is built from purchase price, payload efficiency, fuel use, maintenance and resale, and the hidden costs behind a low sticker price are worth reviewing before the decision is final.
Build the specification on measured data and the capacity decision stops being a guess. Hand your supplier one page of operating numbers, ask for two configurations priced against them, and the comparison becomes a business case instead of an opinion.
Frequently Asked Questions
Does a larger tank always reduce total operating cost?
No. A larger tank lowers the number of stops and the labour hours tied to fuelling, but it adds weight that is subtracted from every load. When that weight replaces revenue freight, the extra capacity can raise cost per ton-mile instead of lowering it. The comparison that matters is total cost per delivered unit, not fuel price per gallon. Fleets that ignore the opportunity cost of lost payload often find the bigger tank only looks cheaper on the fuel invoice.
How do you calculate payload loss per trip?
Compare the tare weight of the proposed tank with the current configuration, then convert the difference into billable freight. The weight difference is the payload loss per trip; multiplying it by trips per period and the revenue rate per unit of cargo turns it into money you can subtract from the fuelling savings.
How many refuel stops does a larger tank typically remove?
On a 1,100- to 1,400-mile round trip, moving from a 120-gallon to a 240-gallon setup commonly removes one refuel stop, sometimes two, at steady fuel economy. Shorter regional routes may remove none. The saving comes from recovered driving hours and reduced detour miles, not from the pump price. Base the estimate on fuel tank capacity on semi trucks matched to your actual lanes.
Can weight limits erase the benefit of extra capacity?
Yes, routinely. Fuel and tank hardware count against gross vehicle weight, so a truck already near its limit loses freight capacity gallon for gallon. Where axle-load rules bind before volume does, added capacity delivers no usable payload and only adds mass. Review the gross vehicle weight rating and scale tickets from representative loads; if the truck is weight-limited, capacity gains convert straight into dead weight.
How does cargo density change the capacity decision?
Dense cargo such as fuel oil or brine fills the legal weight allowance before it fills the tank. Low-density cargo such as certain chemicals hits volume limits first. Size the tank to whichever constraint binds first, weight or volume. For dense freight, lighter tanks and smaller compartments win; for light freight, extra volume pays. Density data from real shipments should drive the choice.
What data should a fleet collect before choosing a tank configuration?
Collect 30 to 90 days of scale tickets, trip logs, fuel purchase records and stop times by route. Include average and peak loads, actual mileage, idle hours and fuelling events per shift, plus loaded and empty weights for each lane and revenue per unit of cargo. That dataset lets you model payload loss per trip, refuel stops removed and opportunity cost together rather than guessing from tank size.
Decision Summary: Matching Tank Capacity to Duty Cycle
A larger tank is justified only when the value of avoided refuel stops exceeds the value of forgone payload across the full duty cycle, and neither side of that comparison stands on its own. Fuel costs the same per gallon in a big tank as in a small one, which is why capacity upgrades look free at the point of purchase. The weight, however, is carried on every trip, and the fuel inside it is bought earlier than the operation strictly needs. Whether the stops a bigger tank eliminates are worth more than the cargo it gives up is a question about the whole cycle, not about a single trip. The opportunity cost of a larger tank is a full-cycle figure, never a single-trip one.
Applied consistently, that framing produces the same sequence of decisions regardless of fleet profile:
- Document the duty cycle. Record route lengths, load weights, delivery frequency, seasonal swings, and where fuelling actually happens across a typical month.
- Quantify the payload loss per trip. Translate the tank’s added weight into the revenue-earning load surrendered on each run, then extend that figure across the cycle.
- Validate legal weight limits. Confirm axle and gross weight compliance with a full tank, a full load and a driver aboard, since legality can eliminate options before economics does.
- Model both cost curves. Set the value of avoided refuel stops against the accumulated payload loss per trip, including driver hours and schedule effects, so both sides are measured in the same currency.
- Compare configurations with a supplier, then confirm service support. Review candidate tank sizes in writing, and verify parts availability, warranty terms and service coverage before committing.
Why the Sequence Matters
The order is not arbitrary. Each step constrains the one after it, and skipping ahead tends to produce a configuration that reads well on a spec sheet and underperforms in service. A duty cycle documented honestly will usually reduce the viable tank sizes to two or three, and weight validation often removes another.
The decision rests on arithmetic specific to each operation, which is why no universal tank size exists. Fleet teams that want to test their assumptions against real build data, weight figures and service terms will find a dealer’s configuration support the most practical starting point before the specification is finalised.